years of relevant leadership experience
Marketing analytics · AI transformation · Strategy
Denis Zelenskiy
Director of Marketing Analytics & AI Transformation
I turn analytics, forecasting and artificial intelligence into an operating system for management decisions.
MAE reduction in a market price forecasting model
faster decision-making after automation
interaction growth despite an 80% budget reduction
StrategyAnalyticsAutomationLeadershipMarket intelligencePricingForecastingAI automationExecutive communication
01
Professional profile
Strategy · Analytics · Automation · Leadership
A leader with 6+ years of relevant experience in strategic marketing, analytics and process transformation.
I build solutions at the intersection of business, data and AI, taking them from problem framing to implementation and executive approval.
02
Experience
March 2025 — presentSNHK LLCHead of MarketingStrategyMarket intelligencePricingForecastingAI automationExecutive communication
Reporting directly to the CEO of a joint venture between SIBUR and Gazprom Neftekhim Salavat. Responsible for strategy, market intelligence, pricing and internal decision-support tools.
- Built a three-year strategy that increased efficiency by 40% during a crisis period.
- Created a Market Intelligence & Forecasting system with 30+ price series, multifactor models, scenario analysis and executive dashboards.
- Reduced MAE of a forecasting model by 42% versus the baseline forecast.
- Used AI to automate data ingestion and quality control, calculations, analytics and executive materials.
- Led automation workshops for directors of the JV participants; the presented tools were accepted for in-house development.
- Signed new contracts with package premiums improved by up to 20%.
September 2023 — March 2025Gazprom PJSCLead Expert, International ExportsInternational marketsFinancial modellingNPV / IRRData automationNegotiationsBoard reporting
Global LNG market analysis, efficiency modelling and executive decision support.
- Developed efficiency models that accelerated decision-making by 27%.
- Introduced language models to automate Excel/VBA macros and large-scale data processing.
- Prepared strategic reports and presentations used to defend key projects before the management board.
- Shortened the international contracting process by 15–20%.
February 2022 — September 2023Ingka Centres (MEGA)Marketing Project LeadMarketing strategyTeam leadershipOmnichannel campaignsSocial mediaEvent marketingAI-powered visual formats
Led project teams, omnichannel campaigns, large-scale events and experimental visual formats.
- Led teams of up to 15 while improving marketing efficiency with an 80% budget reduction.
- Increased social interactions by 200% in three months.
- Produced events attended by more than 1,000 people.
- Used AI to automate visual workflows and create art objects together with local artists.
March 2020 — February 2022FC ZenitPR ManagerBrand strategyPRSocial mediaReputation managementContentCross-functional coordination
Social media strategy, brand reputation and coordination of content, design, video and IT teams.
- Delivered 24% annual audience growth and a 67% increase in engagement.
- Raised the share of positive-leaning publications from 19% to 52%.
- Increased media mentions of Gazprom Arena by 300%.
03
Education
Higher education
2018 — 2020Graduate School of Management, St Petersburg UniversityMaster in ManagementSaint Petersburg, Russia+

An English-taught master’s programme with the international CEMS track.
2019Universidad Adolfo IbáñezCEMS Master in ManagementSantiago, Chile+

An international CEMS semester focused on management in Latin America.
- Ranked first among 30 students in the programme.
- Promoted and helped organise the CEMS LATAM Forum for around 100 participants.
2014 — 2018Graduate School of Management, St Petersburg UniversityBachelor in Financial ManagementSaint Petersburg, Russia+
A foundation in corporate finance, investment appraisal and quantitative analysis.
Additional education
AI for Marketing

Yandex Practicum
AI tools in practiceProject Manager

Skillbox
Project managementFrontend Developer

Skillfactory
JavaScript, HTML, CSSLanguages
RussianNativeEnglishC1 · advancedSpanishB2 · upper-intermediateItalianA2 · elementaryPortugueseA1 · beginner
04
Core skills
05
Portfolio
 01SNHK LLC·End-to-end delivery · under 1 month
Market Intelligence in 28 days
Built a scalable market intelligence, forecasting and pricing system from scratch for CEO-level decisions.
< 1 мес.from brief to working system30+price and driver seriesOpen case↘
Market Intelligence in 28 days
Built a scalable market intelligence, forecasting and pricing system from scratch for CEO-level decisions.
 SNHK LLC
Challenge
- Market data, FX rates, internal calculations and commercial hypotheses lived in separate files and were updated manually.
- Leadership needed one tool that could explain price movements and turn each signal into an actionable scenario.
Approach
- Consolidated more than 30 price and driver series into one historical layer with automated quality checks.
- Built multifactor regressions with statistically significant feature selection, multicollinearity controls and holdout validation.
- Added scenario analysis, a forecasting ensemble, driver interpretation and interactive views for different management levels.
- Designed refreshes so a user only needs to load new data; calculations and visuals then rebuild through one governed logic.
Outcome
- A working version was delivered in under one month, bringing data, forecasting, economics and executive interpretation into one tool.
- MAE for one model fell by 42% versus the baseline forecast. The architecture can be replicated across products, companies and business layers.
- The tools were presented to directors of the JV participants and accepted as a foundation for internal development.
 02Gazprom PJSC·Repeatable end-to-end workflow
AI automation: from PDF to decision
Turned a manual analytics workflow into a reproducible system for processing data and preparing executive materials.
до 80%of time absorbed by manual routine+27%decision-making speedOpen case↘
AI automation: from PDF to decision
Turned a manual analytics workflow into a reproducible system for processing data and preparing executive materials.
 Gazprom PJSC
Challenge
- In some recurring workflows, up to 80% of the time could be absorbed by finding documents, re-keying data and rebuilding the same tables and charts.
- The manual chain delayed decisions, complicated validation and created dependency on individual employees.
Approach
- Decomposed the workflow into repeatable operations and control points: source, extraction, validation, calculation, visualisation and final deliverable.
- Set up PDF and spreadsheet reading, structured field extraction and transfer into validated Excel templates.
- Connected language models with Excel/VBA and Python to prepare calculations, charts, commentary and presentation-ready materials.
- Kept exception handling and final judgement with the analyst, supported by source and output versioning.
Outcome
- Created a repeatable architecture that can absorb new document formats and management requests without rebuilding the workflow from scratch.
- Efficiency models accelerated decisions by 27%, while optimisation of the related contracting flow shortened the cycle by 15–20%.
- This became the first practical use of language models for macro automation and large-scale data processing in my area of responsibility.
 03Ingka Centres (MEGA)·First measurable results · 3 months
MEGA: growth without a marketing budget
Rebuilt promotion around partnerships and owned assets after major tenant exits put both traffic and budget under pressure.
+200%interactions−80%budgetOpen case↘
MEGA: growth without a marketing budget
Rebuilt promotion around partnerships and owned assets after major tenant exits put both traffic and budget under pressure.
 Ingka Centres (MEGA)
Challenge
- After major tenants left, the marketing budget fell by 80%, while remaining partners still needed footfall and visible reasons to visit.
- Buying the usual reach was no longer viable, so value had to be created from the centre’s own assets and partner interests.
Approach
- Built a barter model: MEGA provided in-centre media inventory and owned-channel reach, while partners contributed content, expertise and guest events.
- Engaged IDC, FC Zenit and food tenants in major activations that every participant could amplify through its own resources.
- Rebooted social channels with useful engagement mechanics, gifts sourced from residual inventory and consistent content without paid media.
- Used AI in visual production and collaborative art objects with local artists to sustain quality with a smaller team and budget.
Outcome
- Within three months, social interactions rose by 200% and flagship events attracted more than 1,000 participants.
- The team preserved visibility and event footfall despite an 80% budget reduction by turning MEGA’s media assets into partnership currency.
- The model became a repeatable way to launch campaigns: from a shared business need to resource exchange, combined reach and a measurable event.
 04FC Zenit·Sustained campaign · 2020–2022
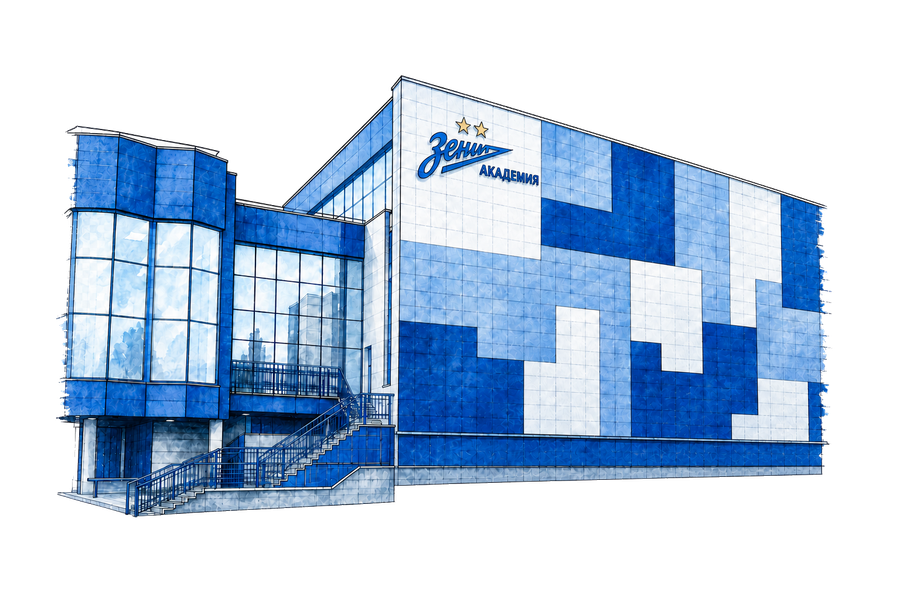
#TimeForYouth: building the Gazprom Academy brand
Shifted the Academy narrative from a shortage of first-team graduates to a systematic story of achievement and player development.
+24%audience+67%engagementOpen case↘
#TimeForYouth: building the Gazprom Academy brand
Shifted the Academy narrative from a shortage of first-team graduates to a systematic story of achievement and player development.
 FC Zenit
Challenge
- The Academy’s media image was dominated by one negative criterion: the number of graduates in the first team.
- Achievements of youth teams and alumni at other clubs did not yet form a visible, coherent brand story.
Approach
- Launched #TimeForYouth and connected matches, team results and alumni stories into one consistent content line.
- Amplified Youth Football League titles with dedicated merchandise, photography, video and editorial support.
- Produced the first Fan Promenades at Smena Stadium for rivalry fixtures, turning Academy matches into standalone events.
- Engaged club legends and first-team players in Academy films and activations, transferring the credibility of the senior team to the youth brand.
Outcome
- The Academy gained its own positive narrative: teams, graduates and their achievements became recurring stories rather than responses to criticism.
- Across the club’s communication system, audience grew by 24%, engagement by 67%, and the share of positive-leaning publications increased from 19% to 52%.
- The campaign created a repeatable editorial framework: team result, individual hero, visual symbol and a fan-facing event.
Open to leadership roles in marketing analytics, strategy and AI transformation.